Power BI Financial Dashboards
Build the P&L dashboard, budget-vs-actual tracker, and executive scorecard that your leadership team will open on Monday morning — and actually trust. Every exercise uses a realistic finance dataset; participants leave with a working report they built themselves.
Enquire about this workshop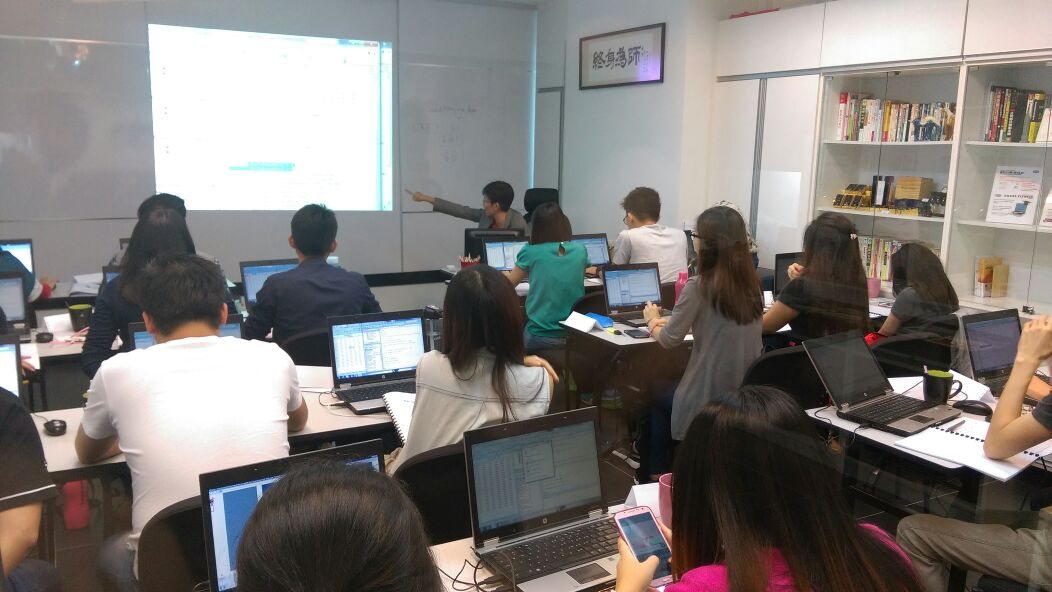
From messy data to a dashboard your CFO will open.
- Data modelling for finance — build a star-schema model with fact tables (transactions, budget) and dimension tables (accounts, cost centres, periods). Understand why this matters for finance reporting.
- DAX measures for finance — write P&L measures, budget variance %, year-to-date calculations, and rolling 12-month comparisons without complex workarounds.
- P&L dashboard — a full income statement dashboard with drill-through to account detail, variance highlighting, and period selectors.
- Budget-vs-actual report — connect your budget file and actuals from GL, combine them cleanly, and build a report that updates automatically when the source data changes.
- Connecting to GL and SAP data — practical techniques for loading trial balance exports, handling sign conventions (debits/credits), and managing account hierarchies.
- Layout best practices for executive readers — how to present financial data for people who will spend three minutes on your report, not thirty.
Finance professionals who are ready to move beyond spreadsheets.
This workshop is designed for management accountants, FP&A analysts, finance managers, and anyone responsible for producing monthly management reports. You should be comfortable working with Excel; no prior Power BI experience is required. If your team is already using Power BI but struggling to make reports that non-finance readers can use, this workshop will address that directly.
Group size is kept small — typically 6 to 20 participants — so there is time to work through problems specific to your team's data and reporting structure.
In-house. Customised. Yours to keep.
In-house at your premises
I come to your office. Your team stays in a familiar environment and does not lose a travel day. I have delivered workshops in Kuala Lumpur, Petaling Jaya, Shah Alam, Johor Bahru, Penang, and beyond.
Built around your data
If you share sample financial data files before the workshop, I will build the exercises around them. Participants learn on data that looks like their actual work, not a generic retail demo dataset.
HRD Corp claimable
All programmes are eligible for HRD Corp (formerly HRDF) funding for registered employers. I am a registered trainer. I can assist with the SBL-Khas application if your HR team needs guidance.
Materials yours to keep
Every participant receives a printed reference guide, the exercise files, and a working Power BI report to take back to their desk. The learning does not stop when the workshop ends.
Rated 4.5 / 5
This programme scored 4.5 out of 5 in post-session evaluations by 25 participants at a global technology company. Results are the metric that matters.
The effective communication from the trainer, and the trainer's ability to guide further whenever there was an issue.
Participant feedback, Power BI Reporting for Beginners workshop, Keysight Technologies
You might also be interested in
Ready to bring this to your team?
Send me a quick note about your team size, current tools, and what you are trying to achieve. I will respond within one business day with a programme outline.
Enquire about this workshop